3 Precipitation
The maps and information below were generated from gridded (spatial) climate normals: values averaged over 15, 30, or 100 years. Data were obtained from the National Centers for Environmental Information (NCEI).
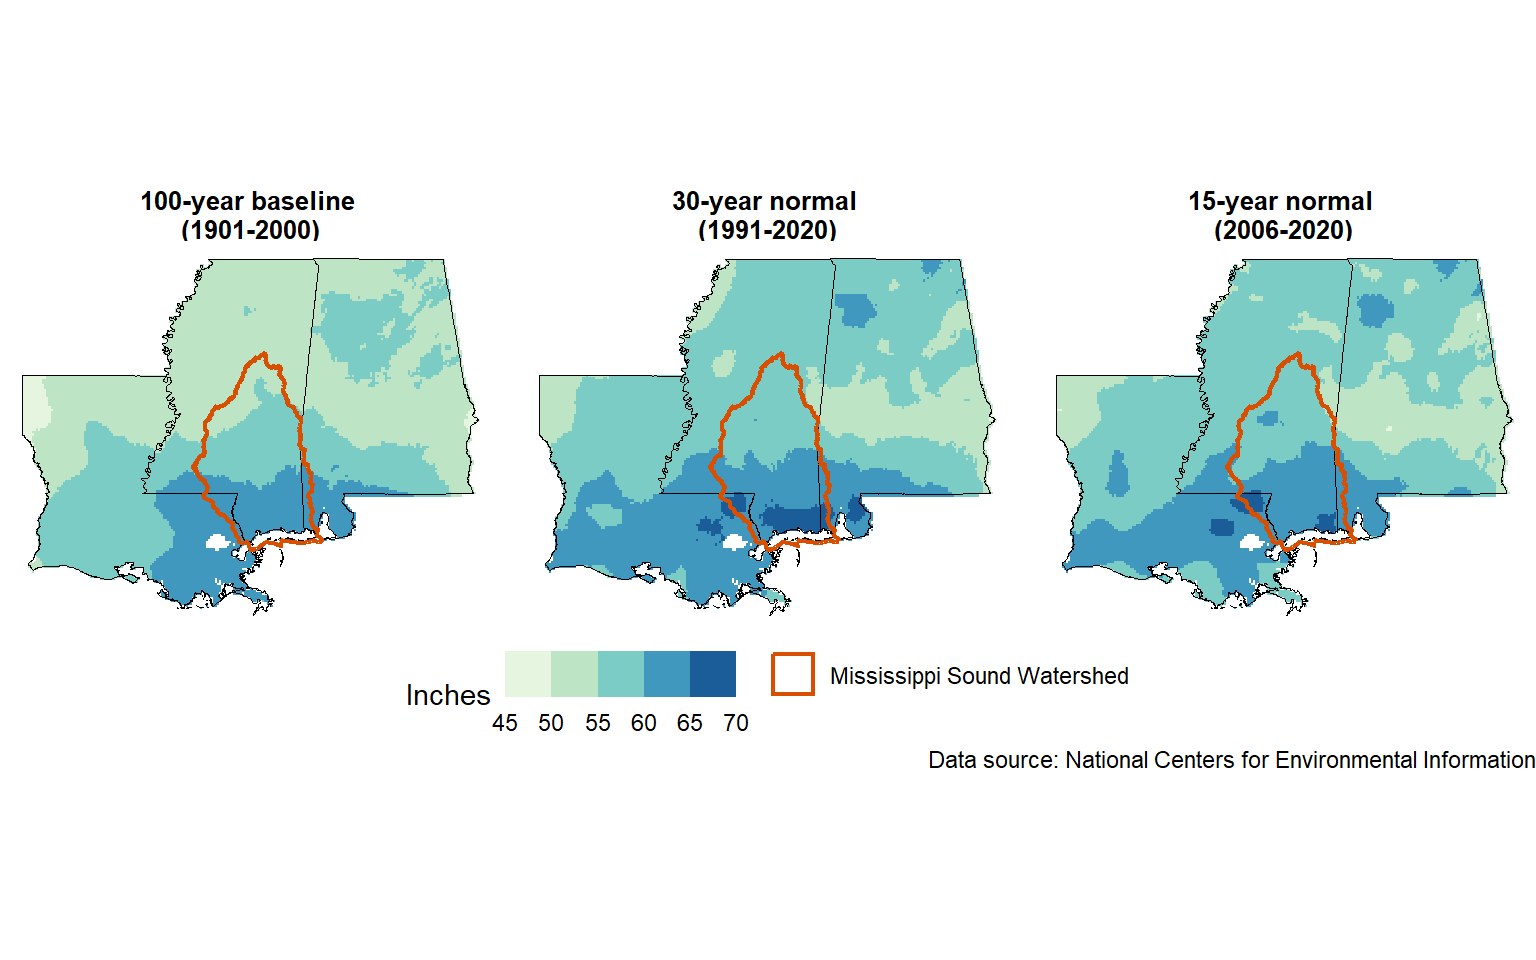
3.1 Annual Totals
The coast receives more rain annually than more inland portions of Louisiana, Mississippi, and Alabama (Figure 3.1). Based on 30-year climate normals (1991-2020), median annual precipitation in the Mississippi Sound Watershed is 60 inches. The lowest annual totals, around 56 inches per year, occur in the northern part of the watershed, with coastal areas receiving around 66 inches per year. These 30-year normals are somewhat higher than the 100-year baseline period of 1901-2000 (min: 52 in; median: 58 in; max: 64 in).
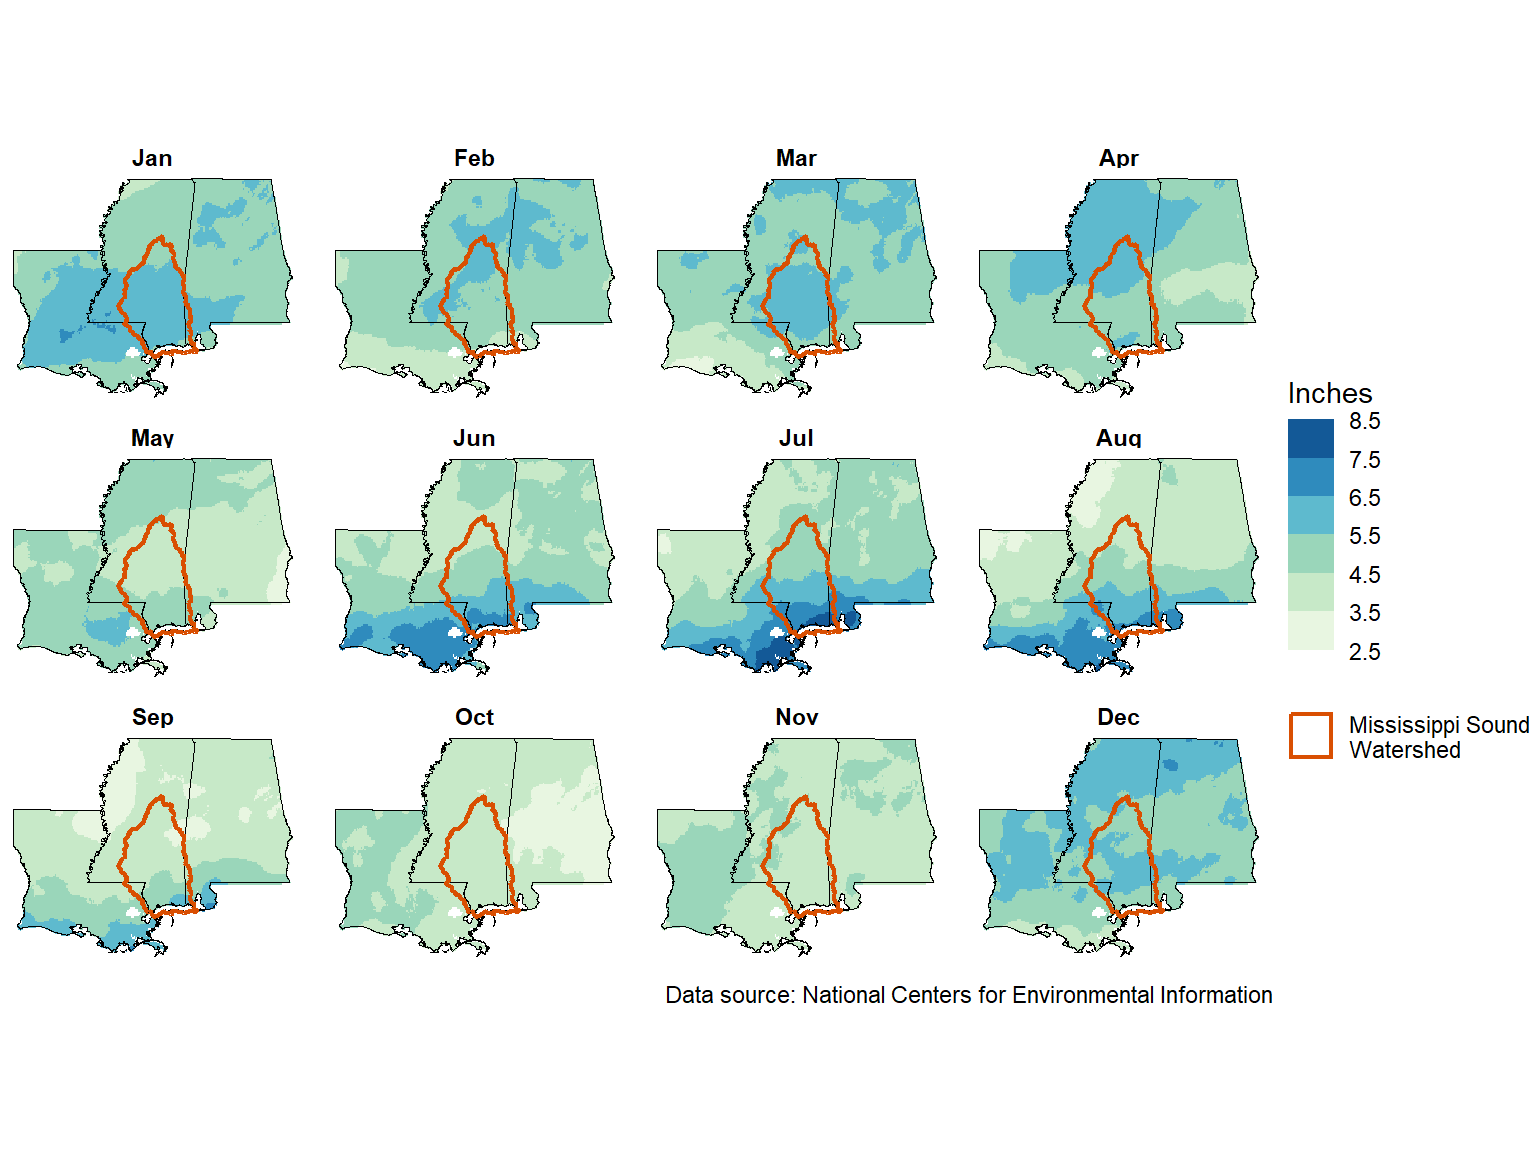
3.2 Monthly Totals (30-year normal)
Seasonal patterns of precipitation also differ throughout the Mississippi Sound Watershed (Figure 3.2). Coastal areas receive most annual precipitation from June through August (up to 8 inches along the coast in July), while more inland areas receive the most from winter through spring. Tropical storms and hurricanes can and do cause higher precipitation totals than these averages; the peak of hurricane season is typically September-October.
About
The .qmd file that generated this section was: precipitation.qmd.
For information on data processing, see Appendix A.2.1.