4 Temperature
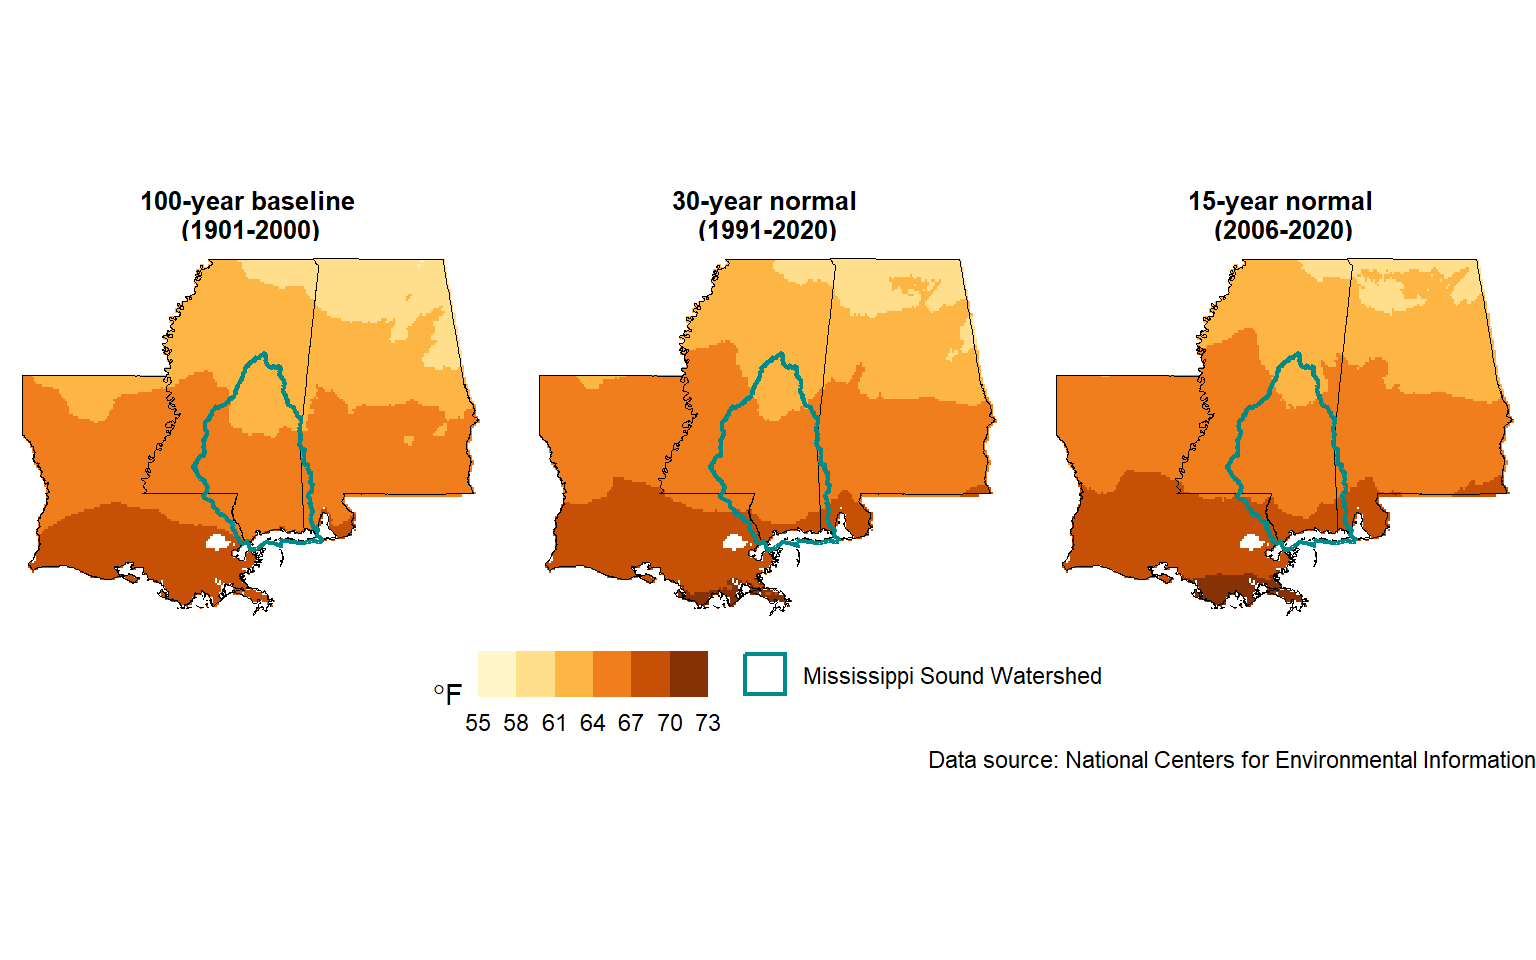
The maps and information below were generated from gridded (spatial) climate normals: values averaged over 15, 30, or 100 years. Data were obtained from the National Centers for Environmental Information (NCEI).
4.1 Annual Mean Temperature
4.2 Monthly Mean Temperature
4.2.1 30-year normals
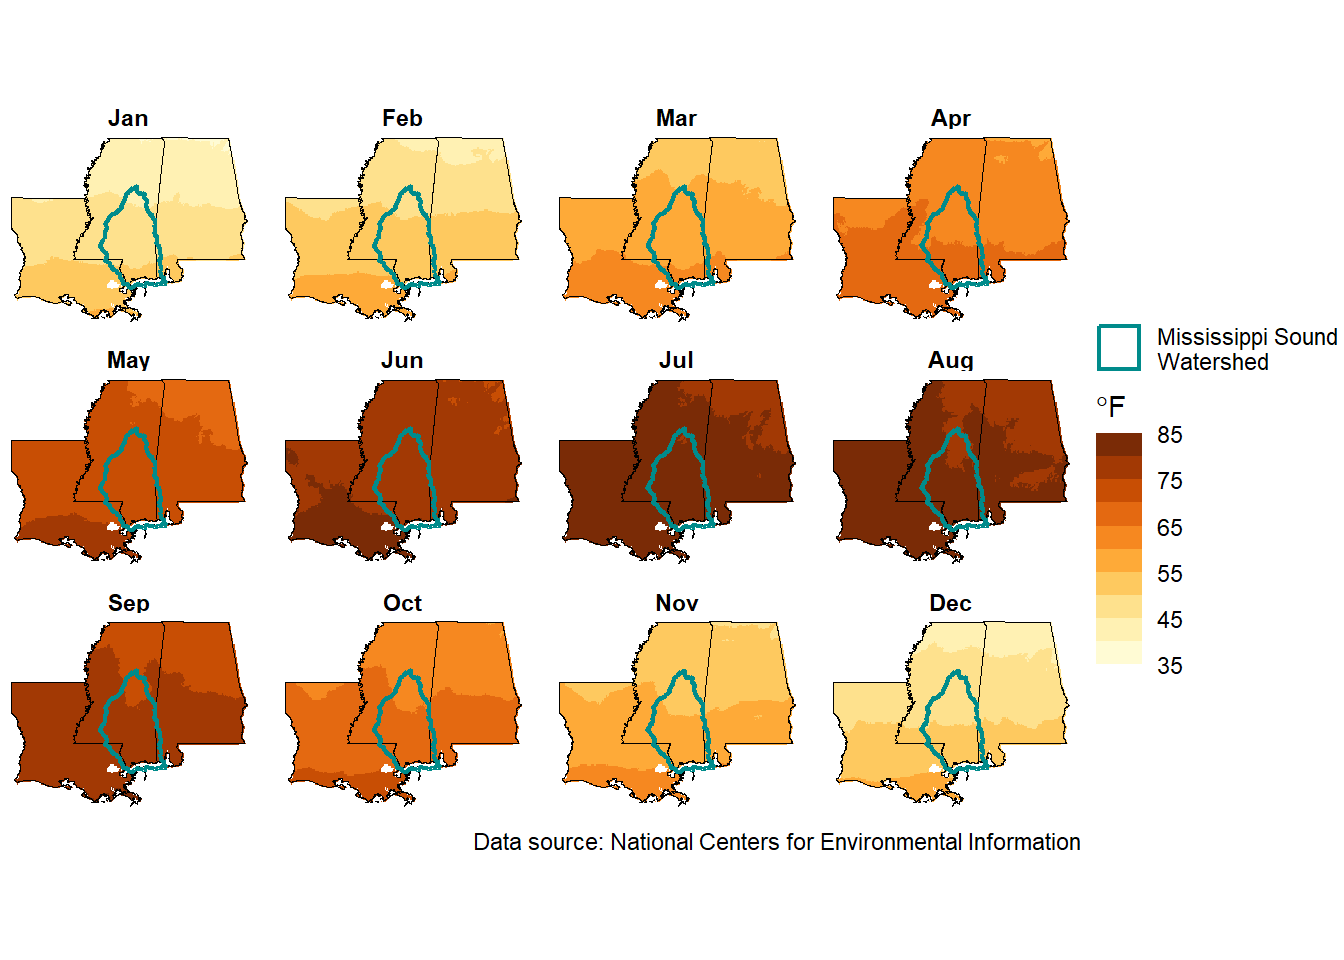
Based on monthly averages over a 30-year period (1991-2020; see Table 4.1 and Figure 4.2), the coldest month in the Mississippi Sound Watershed is January. The lowest mean January value, in the northern part of the watershed, is 43.5 °F, with temperatures along the coast being higher at 52 °F. The hottest month is July, at 79.8 °F in the northern part of the watershed and 82.7 °F along the coast.
| Month | min | mean | max |
|---|---|---|---|
| Jan | 43.5 | 48.1 | 52.0 |
| Feb | 47.4 | 52.0 | 55.7 |
| Mar | 54.7 | 58.5 | 61.4 |
| Apr | 61.9 | 64.9 | 67.9 |
| May | 70.1 | 72.5 | 75.3 |
| Jun | 77.2 | 78.8 | 81.1 |
| Jul | 79.8 | 81.1 | 82.7 |
| Aug | 79.3 | 80.6 | 82.9 |
| Sep | 74.0 | 76.2 | 79.4 |
| Oct | 63.1 | 66.1 | 70.8 |
| Nov | 52.3 | 55.9 | 60.6 |
| Dec | 45.8 | 50.1 | 54.3 |
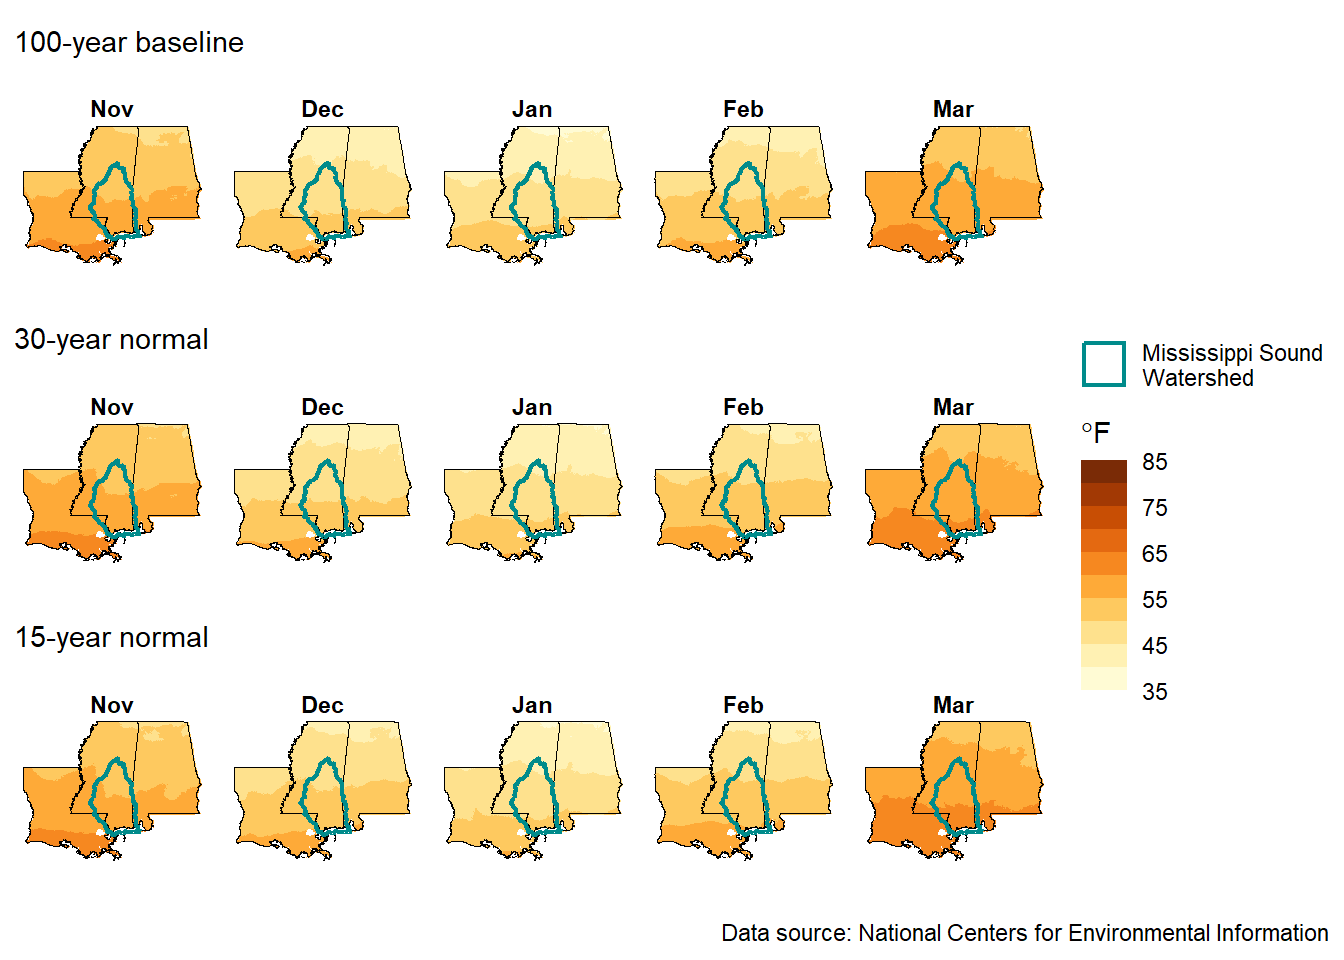
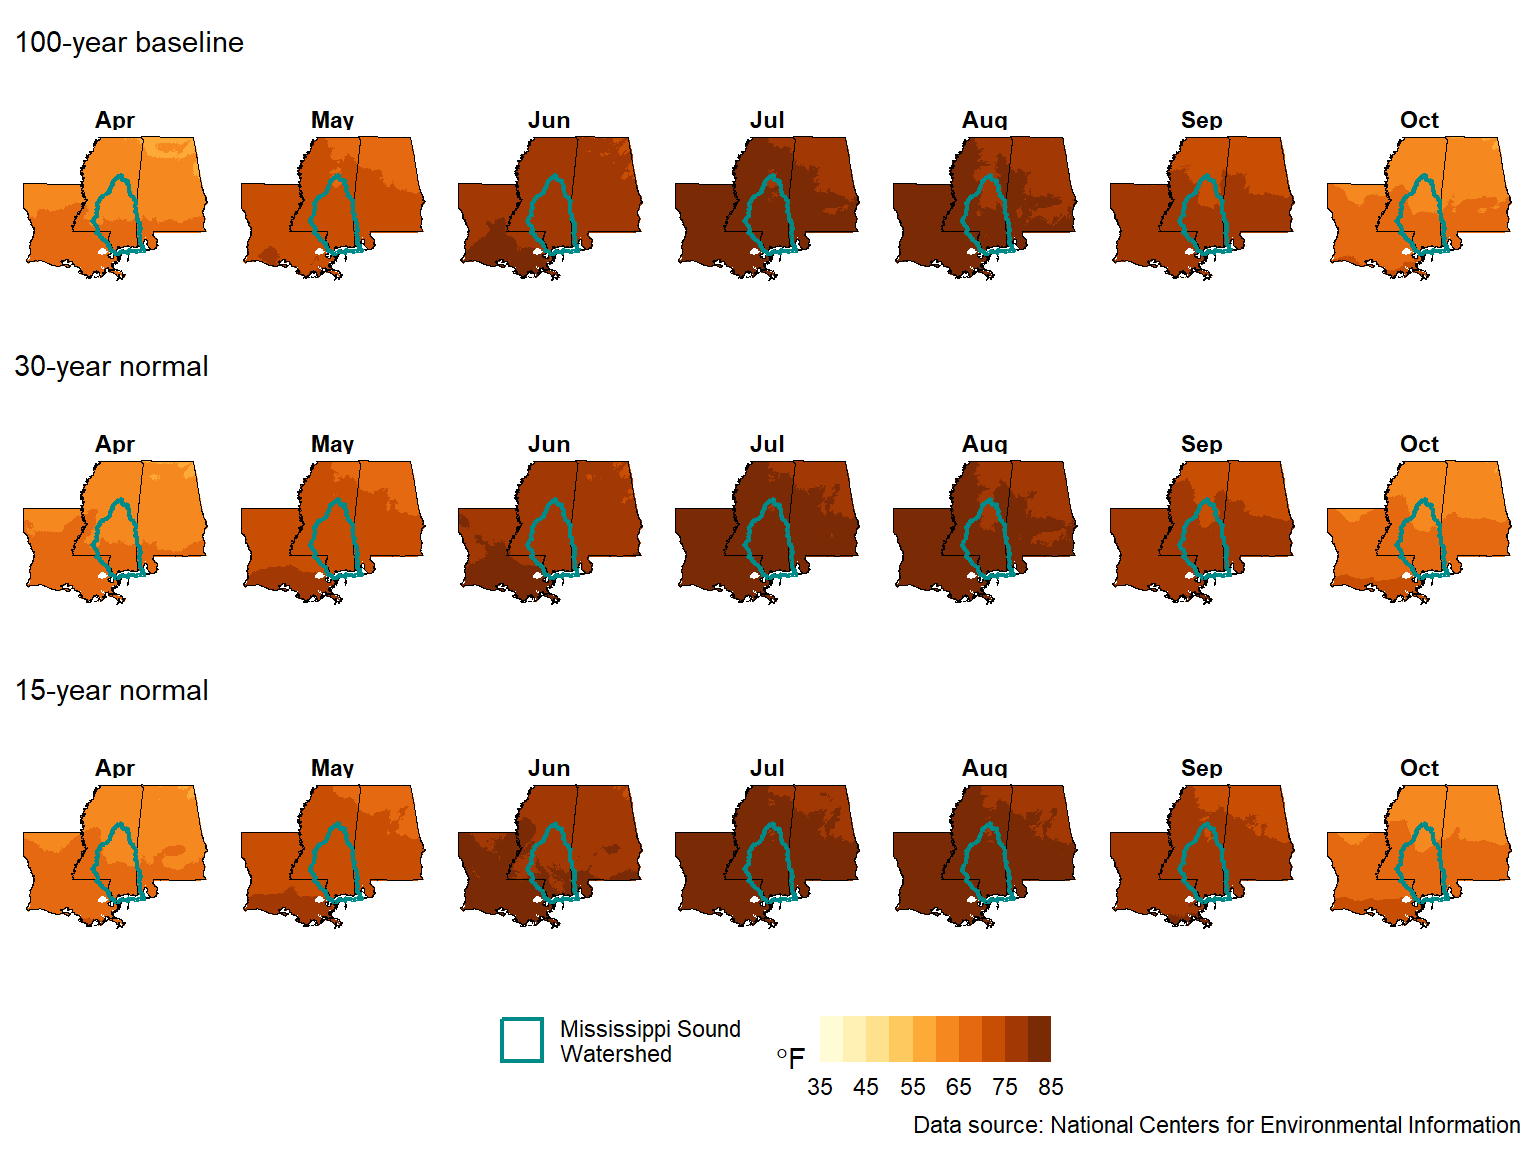
4.2.2 Comparing time periods
The maps below show only a subset of months. Each map contains the averages over a 100-year baseline, and 30- and 15- year normals. Each time period is a row, and the months line up vertically. Louisiana in particular shows some differences based on the time of aggregation in March and June.
4.2.2.1 Cool Months
4.2.2.2 Warm Months
About
The .qmd file that generated this section was: temperature.qmd.
For information on data processing, see Appendix A.2.2.